
How long does it take you to complete a task or project? Answers to this question will help you to monitor deadlines and team effectiveness. Forecasting and planning are top actions on the “to-do list” for agile managers. While some teams love to use velocity and story points, others like more real-world options based on time. Analyzing cycle time and lead time is the way to go. What is the difference between them? We’ll cover it in this article, as well as the tools you can apply to measure lead and cycle time in Jira.
What is Cycle and Lead Time?
Jira Cycle time is known as the time it takes for an action to complete from start to finish. It’s the phase when the issue is labelled “in progress.” The statuses used to compute cycle time are determined by the Jira workflow you’re employing.
Jira Lead time refers to the time between receiving a request for an action (not the start of work) and the completion of that action, including time spent in the queue.
But who loves the definitions. Let’s imagine a situation where you’ve ordered your favourite pizza. The time it takes to make the dough, add all the ingredients, bake it and deliver to you is cycle time. Lead time will be calculated from the moment your order is received till it’s before your door or on your plate.

Now, let’s come back to Jira and look at what solutions it offers out-of-the-box.
Jira Control Chart: how it helps
The Control Chart is a tool that helps you quickly analyze total Jira cycle time and lead time for Jira classic projects. It can be a sprint, a particular version of your service or product, or any other item you require. You should add statuses that represent cycle or lead time to configure the chart.
How to read
You can find the Jira Control Chart in the Reports left sidebar menu. The red line represents the average time spent, and the blue one is the issue-based rolling average. The rolling average is determined by averaging the cycle times of the issue + X issues before the issue + X issues after the issue. The blue shaded area
With Jira Control Chart, you can:
- See average data for some issue or cluster of issues (dots on the chart)
- Select a timeframe and analyze it for a chosen project
- Use instant filters, column settings, and display tweaks to quickly customize the report (for example, removing non-working days)

If your project deviates fslightly rom the average cycle (lead) time, you can be confident that your project pipeline will function smoothly. Strong spikes above the average on a Control Chart diagram signal an issue with your team’s workflow. It may include delays, long waiting periods, downtimes on pause, etc.
Jira Cycle time report
As its name says, you can apply this report to measure Jira cycle time solely. It consists of two graphs. The first one is a weekly comparison based on the number of issues during the 12-week period. To configure the report, you need to choose the issue type and epic.

The second part shows issues you deliver each week separately. If you point to the dot, you’ve got the time it was in work.

Jira Cycle time report and Control Chart are great tools to assess a project’s overall situation fast. So, you can track cycle and lead time data and analyze it graphically.
To boost Jira Cloud’s quick orientation in cycle (lead) time bottlenecks, our SaaSJet team created Time in Status for Jira Cloud and Time Between Statuses plugins (work for Jira’s classic and next-gen projects). Let’s look closer at each.
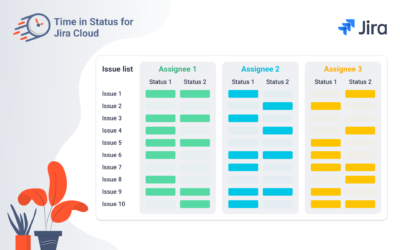
Time in Status for Jira Cloud
Time in Status for Jira Cloud is an Atlassian Marketplace add-on that allows you to collect cycle and lead times by configuring Status Groups. With the drop-down list of statuses in the Column Manager, you can set it from your account. Time will be summarized according to custom statuses in the status group column.

E.g., If you want to get Jira cycle time, choose the statuses which will represent a time for different “in progress” stages. For example, if you use the “Jira Software Development” workflow, your team’s work on an issue begins when it’s in the “In Progress” phase and ends when it’s moved from “In Review” to “Done.”
As a result, the “In Progress” and “In Review” statuses will appear in the Cycle time column.

In addition to the Time in Status report for a cycle or lead time, you may use the following:
- Average Cycle or Lead Time ⇒ choose the Average time report
- Cycle or Lead Time per Date ⇒ select the Time in Status per Date report
- Jira Cycle time and Lead Time for each assignee ⇒ go to the Assignee time report
- How many times the issue was at the statuses from Status Group ⇒ the Status Count report
To customize your reports with cycle or lead time, you can:
- select the necessary issue list from projects, sprints, apply flexible filters with tags
- specify the date range and data format
- exclude non-working hours from the cycle or lead time calculation with multi-calendar
You can add a custom report to the Jira dashboard with the Gadget tool.
By exporting data to Excel or Google Sheets(XLSX or CSV format), users may dig deeper into all of these reports.
Time Between Statuses
Time Between Statuses (Cloud & Server) is another Atlassian Marketplace plugin. However, it differs from the previous one in some ways. It calculates the number of connections in a workflow by calculating the transition time it takes for issues.
This app assists in locating the problem area and notifying the user in time. As a result, you’ll be able to fix it instantly.
To measure cycle and lead time, set start/stop and pause statuses in the configuration manager. You should choose the first/last transition to/from status to specify the computation conditions. It increases the flexibility of the timer.

The ability to receive visual alerts is a valuable feature when dealing with many processes. As a result, you can define Warning time limits. The system will send an email notification to the designated admin if too much time is spent on a given issue. You can also establish Critical time limits.
This is the last warning that can alert the project manager about a major issue with the workflow. The ability to recognize a problem aids in the prevention of significant losses.

You can tailor your cycle and lead time reports by changing the fields in the app interface:
- Project type
- Date range
- Time format
- Multi Calendar (to set non-working hours and different calendars)
You may see the transition time for a given issue in the Issue View Panel. It’s a progress bar with three zones: green, yellow, and red. Time Between Statuses also lets you export data so you can utilize the tools you need to go deeper into cycle and lead time.
Monitoring Jira cycle and lead time help to analyze and save time for your workflow and projects. You can get them using Jira built-in solutions such as the Control Chart, Cycle time report or Atlassian Marketplace alternatives. Time in Status for Jira Cloud and Time Between Statuses are two of the SaaSJet solutions available.
Do you measure Jira cycle and lead time? Write in comments which tools you use. If not, try how you can make your team more effective. We’ve described four ways to analyze lead and cycle time in Jira. Test these options and tell us which one works best for you.

Find out more about Time in Status for Jira Cloud
Visit the app page for more information


I have used Jira for a couple of years now and have been looking for a nice way to track the time between statuses for issues. The most popular solution I found was a plugin called Time Between Statuses for Jira – a plugin available from the Jira Marketplace. However, I thought that the time between statuses functionality should be built into Jira itself, not a plugin. But this functionality is much better than what is in the Jira