Jira Time in Status by SaaSJet. How can it help?
If you are working in Jira, you know how a multitasking environment and interruptions can law team effectiveness. But how can you track delays in your workflow process? The SaaSJet team works to equip you with efficient decisions for time control in projects. Let’s overview our app which calculates the time in status for the cloud version of Jira.
Since launching the plugin Time in Status for Jira Cloud, it’s constantly getting new features, elaborating the old ones, and improving its user experience. As a result, you can generate 7 types of time reports and improve your team efficiency with just a few clicks in the application.
Time in Status for Jira Cloud by SaaSJet helps you control the time issue spent in the workflow at each status. As well you can get time in a status group, average time, assignee time or user groups time in status, and others. It allows you to quickly find problem areas and positive dynamics by chart report, monitor time spending at issue panel, and export data you need.

7 reports for managing time
As mentioned above, Time in Status for Jira Cloud provides you with 7 types of reports: Time in Status, Assignee Time, Average Time, Status Entrance Date, Time in Status per Date, Status and Transition Count.
The main goal/purpose of this add-on is so you can generate data about time in status. The following four reports of this application are bringing different information about time in status spending. Let’s learn more about the practical use of each one.
Time in Status
Report Time in Status will help you to determine the time duration of each issue when it has been staying in different Jira statuses. With this report, users can monitor the current status of the issue and the total time it has spent in all statuses (and add other custom fields in column manager).
In order to see even more relevant data of Time in Status report, you can choose one of the multi calendars (available for all reports). Thus, you’ll have the preside data on the team you want to get more efficient and improve their performance.
The additional feature of this report is that here you can monitor Lead time and Cycle time by setting a Status group. Check out the article 3 tools to analyze Cycle and Lead Time in the Jira to get more info.
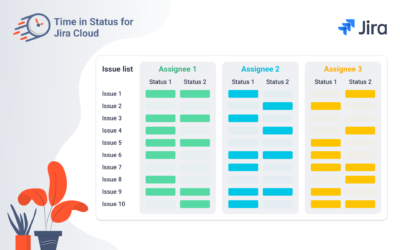
Assignee Time in Status
Report Assignee Time calculates the time that a particular team member was assigned to the issue. Also, with this report admin can create custom groups. For example, if you have two teams to support L1 and L2, you can customize each column by adding a user group for each team.
Average Time in Status
This report calculates average time issues spent in every status during a specific period of time. Moreover, users can get an average cycle and lead time using the feature of the status group. Average Time in Status report provides you with the opportunity to compare data at different frequencies: hourly, daily, weekly, monthly and quarterly. To get the helicopter perspective on average time in Jira status, it is very convenient to view this report as a chart (Pie, Bar Area charts).
Time in Status per Date
The Time in Status per Date report gives you the sum of all times the issue has been in a particular status and date. The main advantage of this report is that you receive an overall picture of the total time spent at all statuses at the chosen time period.

Now let’s dive into the remaining three reports.
These next reports give you a historical view of the workflow steps in Jira. In other words, you can monitor when exactly the issue moves in the work process through time.
Status Entrance Date
Shows the date and time when every issue entered each of the statuses for the first time.
Status and Transition Count
Report Status Count calculates the number of times an issue has been in each status and Transition Count lets you know how many times an issue has gone from status to status. So, these reports will get a more precise perspective when monitoring workflow processes in your projects.
You can export all reports as XLSX or CSV files and dive deeply into analyses for improving your business decisions.
Extra features you can get with Time in Status
Chart Reports
You can view and control many-tasking projects at glance using one of our main features – Charts view (Pie, Bar, and Area).
It cuts you the wearisome process of importing the data and building charts manually. With Time in status for Jira Cloud charts, this information is always one click away. And at any time you can quickly monitor and evaluate the current situation, dynamics, and tendency for operational decisions and actions.

For sharing charts with your colleagues or customers, just download them in suitable formats for you, like PNG, JPEG, or PDF. Then send it to them as an attachment with some positive notes. Also, you can use graphs for presentations and save your time avoiding unnecessary work.
Pivot Table
With Pivot Table View you’ll get more functions for report analysis. You can monitor time for any issue fields and any combination of issue attributes. Math functions (Average, Min/Max, Median, Count, Sum, etc) are available to manipulate the data you need.
Issue View Panel
This tool allows you to immediately view data about time in status in the taskbar without entering the application. The special feature of this panel is that the data can be estimated here not only based on the stats, but also on the graphic image. Besides Time in Status report, you can get Average Time in Status, Status, and Transition Count reports. Moreover, here you can configure Metrics and Calendar options.
Jira Time in Status Gadget
The gadget lets you monitor customized reports from the app on the Jira dashboard. All add-on reports are available at this gadget and you can control time in status data in Issue List or Chart View.
Requests/Questions Section
We are constantly working on new functions to make your experience with the add-on as best as possible. Stay tuned for more upgrades.
If you feel like there’s something missing, share your suggestions. Let us know what features you need to manage your time in Jira.
Takeaway
We’ll be happy to read your questions or feature requests. Please email us at [email protected]. Your sincere feedback is more than welcome.
If you still haven’t tried our app, install its trial at Atlassian Marketplace. You can also get its lite version Time in Status Lite.
Have one more data-driven and productive day! 🙂

Find out more about the Time in Status for Jira Cloud
Visit the app page for more information