We all want to have control over things that matter to us. Especially when you manage a team, it’s important to understand how things are moving in the workflow. Our SaaSJet team continuously improves its products to provide more and more efficient data for management. Recently we’ve launched the new version of Time in Status for Jira Cloud with Gadget.

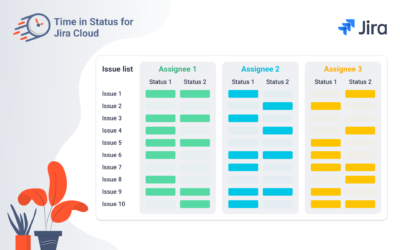
View all the data with Gadget on Jira dashboard for Time in Status for Jira Cloud
Time in Status for Jira Cloud Gadget is a tool that displays all data from the add-on at Jira Dashboard. It has all the main features as in the app Time in Status for Jira Cloud and much more. The gadget lets you view the data you are interested in without necessarily going to the plugin. Once it’s configured, all the most important numbers/charts and stats from the application will always be at hand in your dashboard.

Main gadget’s features:
- All reports from the app are available: Time in Status, Assignee Time, Average Time, Status Entrance Date, Time in Status per Date, Status Count and Transition Count.
- With Advanced configuration, you might set preferred Data filtering, ranges and Team calendars. Feel free to do some experiments anytime with the Edit button :).
- Chart and issues list view. The devil is in the detail, with that in mind we added those features for you to choose and configure the list view. Visualize the data as charts and get an overall picture of your workflow. Pie, Bar and Area chart types are available.


Already wondering how to start?
First things, make sure you’ve installed the latest version of Time in Status for Jira Cloud add-on (How to update the Add-on?). Then click the Add button on your Jira Dashboard and choose the Time in Status for Jira Cloud Gadget. Select and set reports in the configuration manager to monitor all important data.
Haven’t used our app yet?
Let’s fix it, shall we? Install Time in Status for Jira Cloud on Atlassian Marketplace and check all its features, including gadget options.
Your feedback is always something we look forward to the most to become better at what we do. Don’t hesitate to drop us a message about the experience you had with our add-ons. Contact us through SaaSJet Support or via email [email protected]

Find out more about the Time in Status for Jira Cloud
Visit the app page for more information